Hotel Profile and Starting Point
*This case study is based on a real client engagement. The hotel name, location, and some figures have been changed for confidentiality.*
This Aegean boutique hotel operated seasonally with 40 rooms and a full-service restaurant overlooking an outdoor pool. The property had been managed by the same family for five years, and the F&B operation ran on seasonal staff with no central operating system.
Starting position — measurable indicators:
| Indicator | Starting Value |
|---|---|
| Monthly F&B gross margin | -4 percent (negative) |
| Food cost ratio | 48 percent |
| Active menu items | 87 |
| Written recipes | 0 |
| Weekly food cost report | None |
| Pre-season team calibration | None |
This table showed that the operational problem had more than one root cause. But the most critical observation was this: management was aware of the food cost problem, but did not know where it was coming from.
Diagnosis Phase: First 30 Days
Diagnostic work in the first 30 days focused on four areas:
1. Menu analysis: The 87-item menu was reviewed. By sales data, 40 percent of items were generating 5 percent of revenue. These items were adding kitchen complexity and tying up stock.
2. Supply chain analysis: Three months of supplier invoices revealed quantity and price inconsistencies on delivery. Average invoice variance on receipt was 7–12 percent.
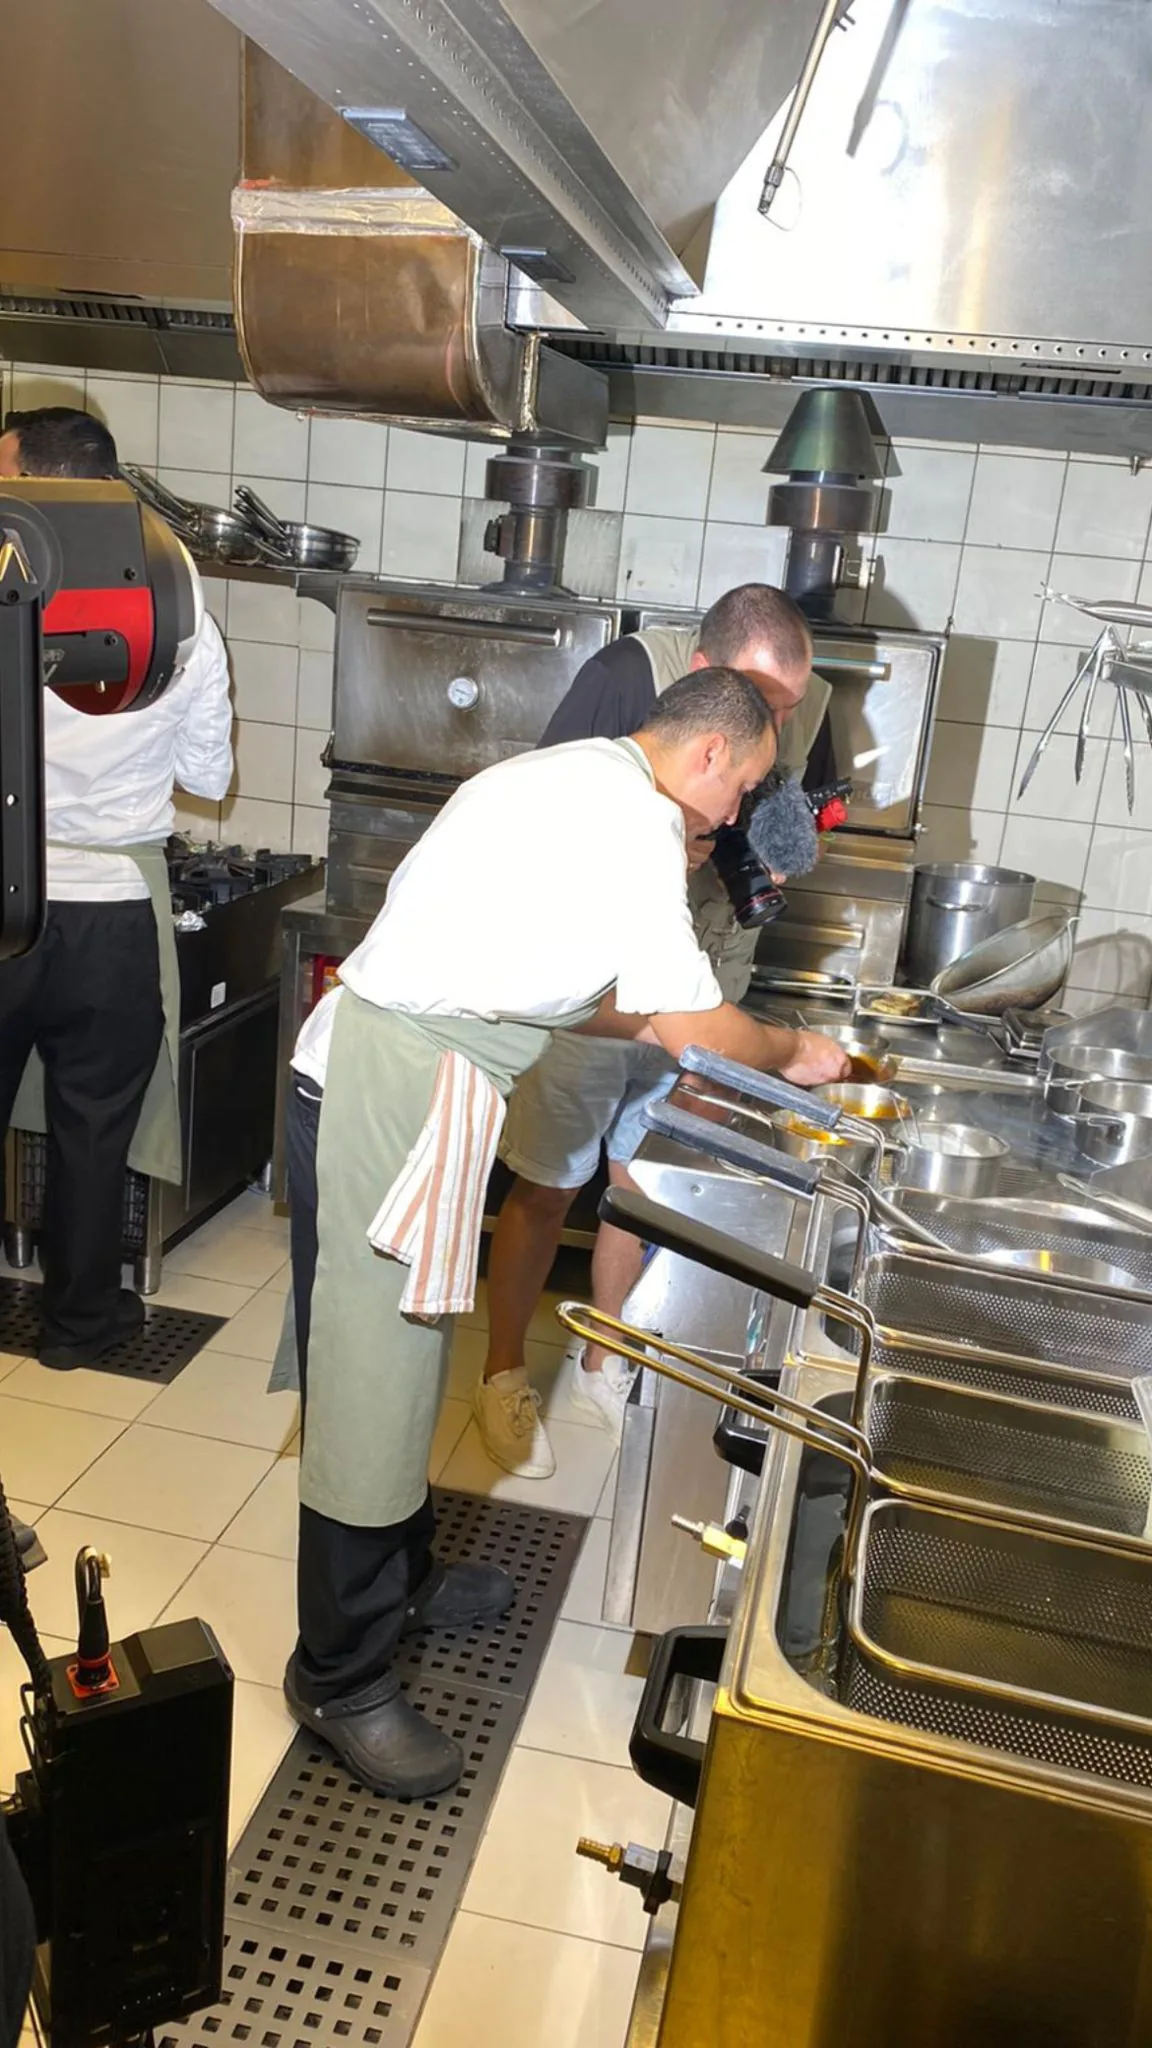
3. Kitchen observation: Across three consecutive services, the same item was produced with 30–50 percent portion variance. Without a recipe system, every cook was applying their own interpretation.
4. Team interviews: Conversations with kitchen and service team revealed two core problems: the menu was too complex, and kitchen-service communication had significant breakdowns.
Diagnosis summary: 62 percent of the food cost problem came from three sources — absence of written recipes, stock held for slow-moving items, and absence of supplier invoice reconciliation.
Infrastructure Phase: Days 30–90
Based on the diagnosis findings, six concrete steps were taken in the infrastructure phase:
Step 1 — Menu revision: The 87-item menu was reduced to 42 items using a sales analysis and cost-profit matrix. Items removed were both low-volume and high-cost.
Step 2 — Recipe system installation: Weight-based, photographed recipes were produced for all 42 menu items. Each recipe was laminated and posted at the relevant kitchen station.
Step 3 — Weekly food cost tracking: A simple spreadsheet tracked weekly supply cost as a percentage of weekly revenue. First reading: 44 percent.
Step 4 — Supplier controls: A price confirmation email procedure was established with primary suppliers. Weighing on delivery was standardised.
Step 5 — Service-kitchen communication protocol: Order flow, output-time notification, and allergen procedure were documented and briefed to the team.
Step 6 — Team calibration: A 3-day calibration was run with the existing team: every menu item was produced in the kitchen once, and portion and presentation were calibrated.
By day 90, food cost had fallen from 44 to 36 percent — the first signal confirming the infrastructure was working.
Execution and Stabilisation: Days 90–365
From day 90 onward, the focus shifted from infrastructure to consistent execution. Monthly review meetings were held, findings evaluated, and adjustments made.
Monthly tracking metrics:
| Month | Food Cost | Monthly F&B Margin | Note |
|---|---|---|---|
| Month 3 | 36 pct | 8 pct | Infrastructure settled |
| Month 6 | 32 pct | 14 pct | Menu optimisation complete |
| Month 9 | 30 pct | 18 pct | Team calibration stable |
| Month 12 | 28 pct | 22 pct | Target margin reached |
At season close, an SOP archive was created for use in the following season and chef continuity was planned.
Measurable Outcomes
Summary results of the 12-month turnaround:
| Indicator | Start | End | Change |
|---|---|---|---|
| F&B gross margin | -4 pct | 22 pct | +26 points |
| Food cost | 48 pct | 28 pct | -20 points |
| Active menu items | 87 | 42 | -52 pct |
| Written recipes | 0 | 42 | Full coverage |
| Weekly reports | None | Regular | System built |
| Guest review score (food) | 7.2 | 8.6 | +1.4 points |
By the endpoint, the hotel was running its F&B operation as a profit centre.
Key Learnings
Three core learnings from this case study:
1. No diagnosis, no solution. In this hotel, management was aware of the problem but had diagnosed the source incorrectly (attributing it to a staffing problem). The real root cause was a systems deficit. Any intervention that starts with the wrong diagnosis stays unresolved.
2. Menu complexity carries an invisible cost. The 87-item menu was increasing stock cost, kitchen complexity, and training load simultaneously. Moving to 42 items reduced cost and also improved service quality.
3. Systems do not replace people, but they make people consistent. The recipe system required no equipment changes and no new hires. The same people, working systematically, produced different results.